Designed by GOEMO.de
Copyright © 2013 by "Rainer Sobottka www.ir-engineering.com" • All Rights reserved • E-Mail: consultantir-engineering.com
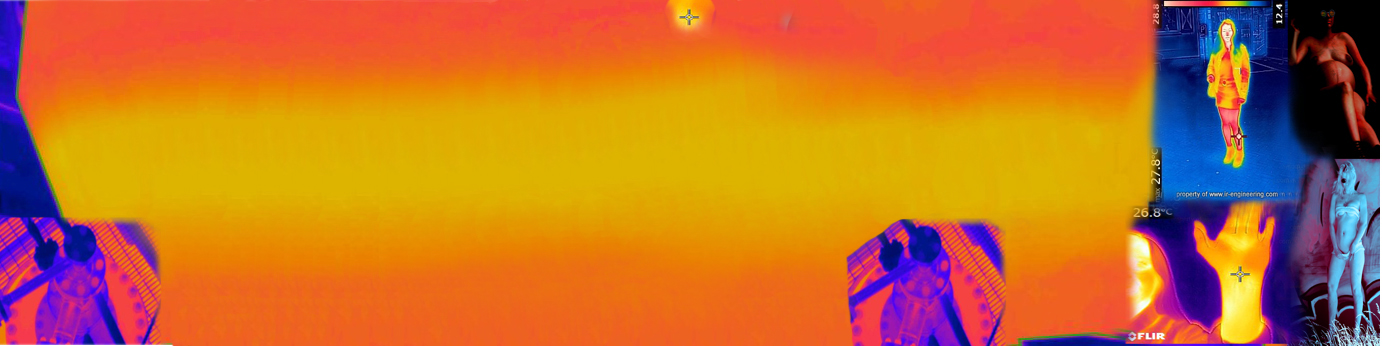
thermal imaging in chemical plant at hotspot-POX reactors, substations, leakdetection and many more
ir-engineering.com
Application-3: Reformer
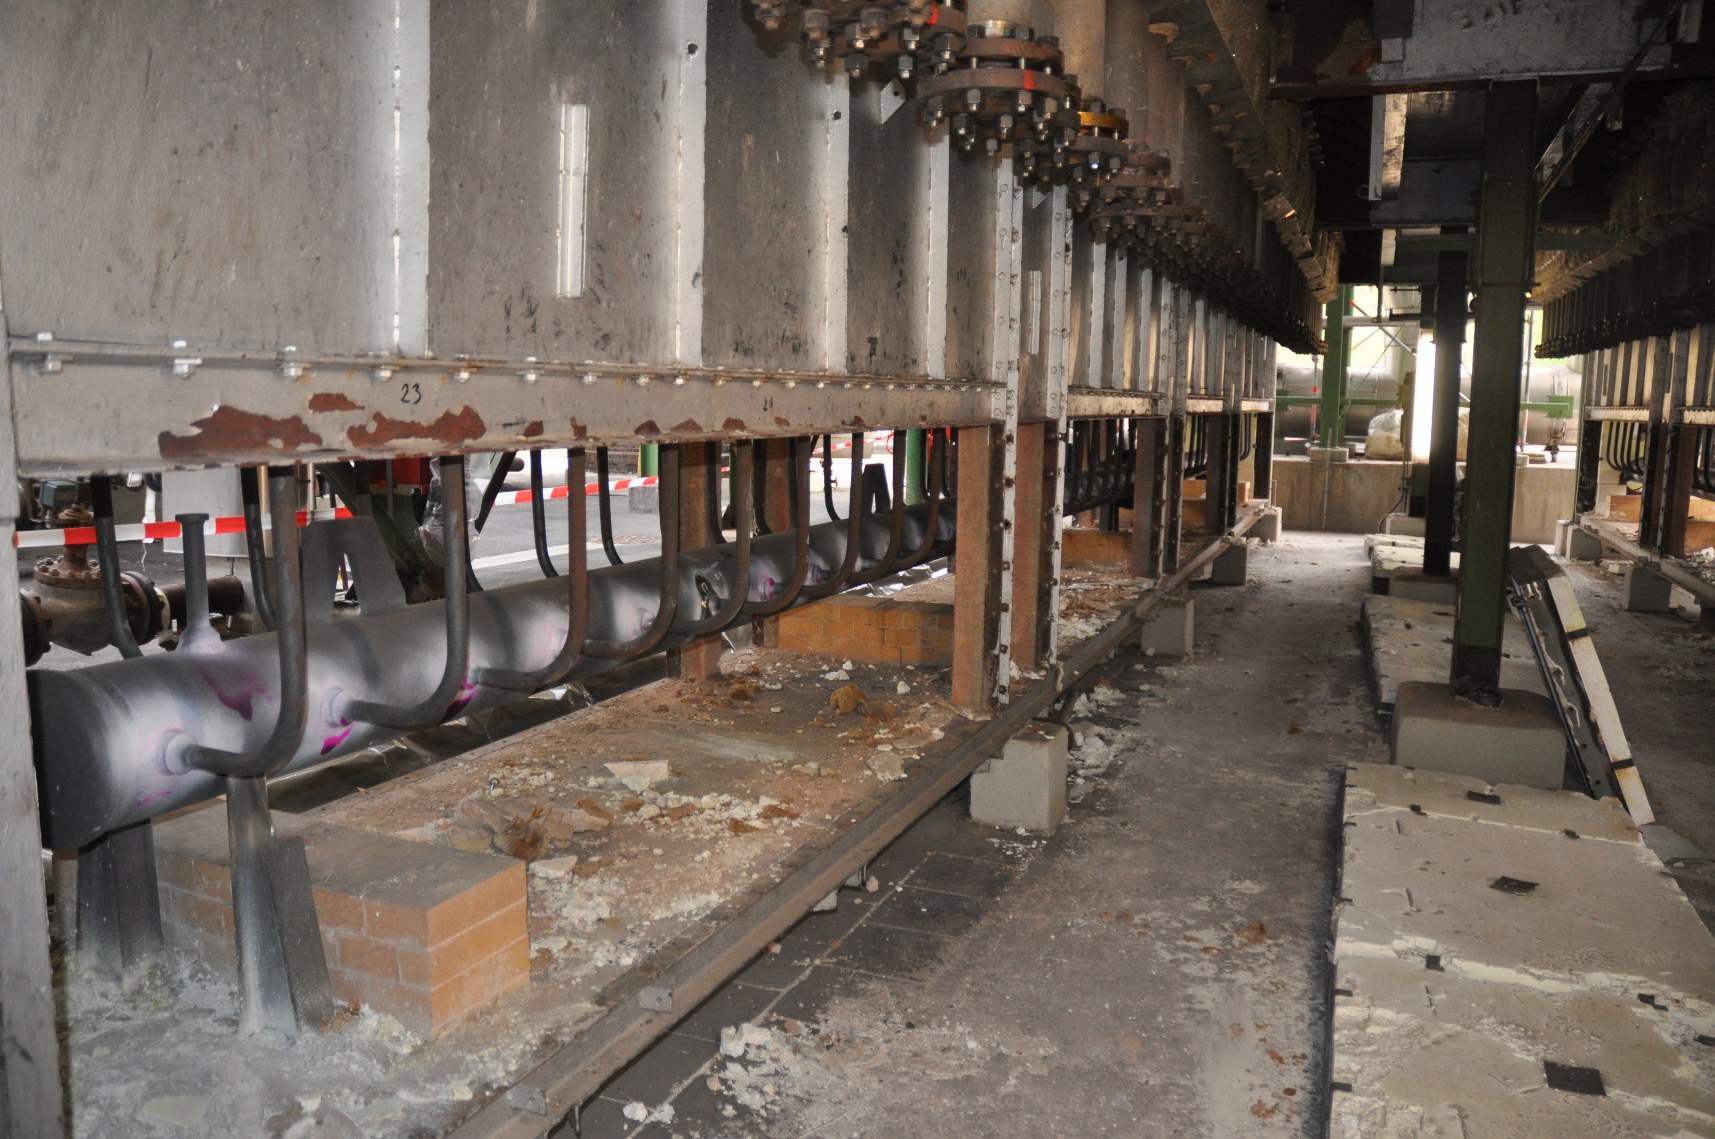
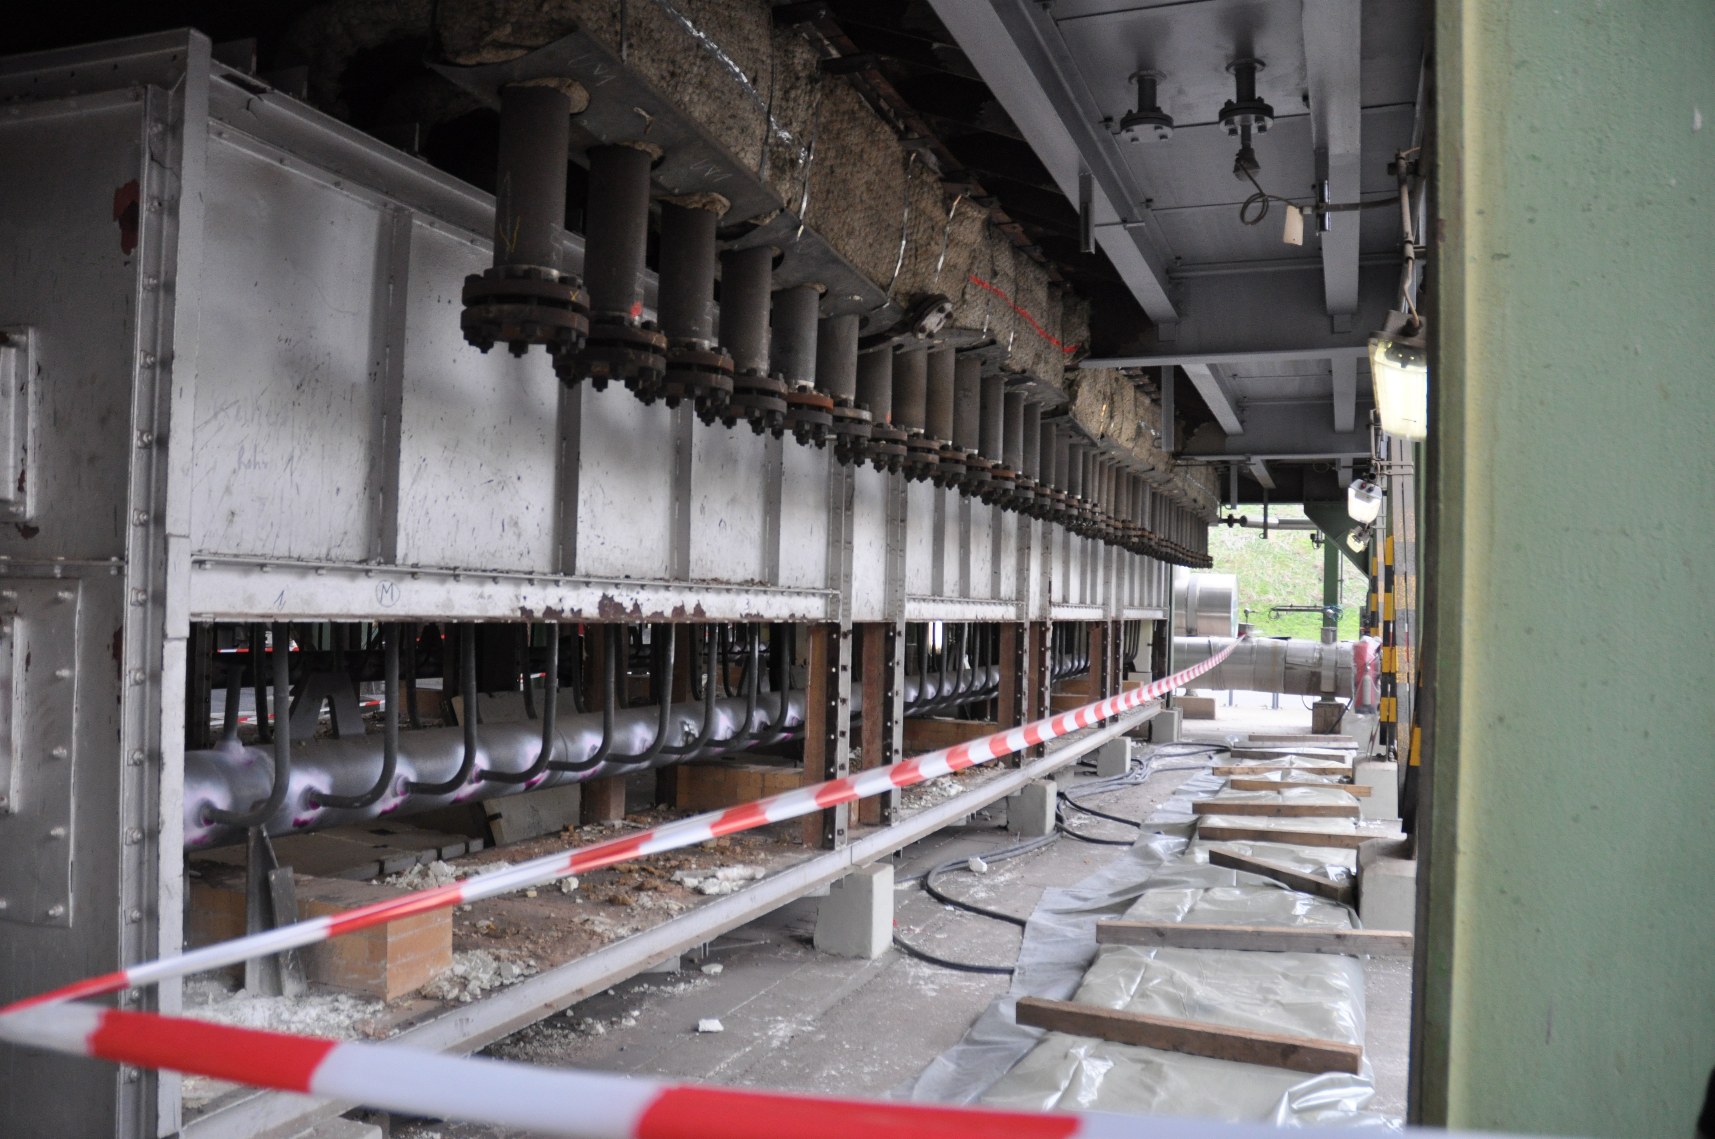
Reformers, crackers and other furnaces, where pipes run through the fired chambers and must be heated, face the problem that fouling or deposits inside the pipe can not be detected, respectively cannot be continuously monitored. Only after long time and after great changed in outside temperature it was possible to conclude for a different operation (regeneration, cleaning, etc.). Material blocks the inside pipe area where the medium runs through in high velocity and with high temperature. Deposits inside on the inside wall of the pipe lead to disturbed and interrupted operation, in extreme cases the pipe will burst/explode without any notice before.
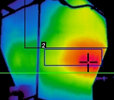
Only infrared cameras now are suitable to be installed into the furnace wall, measuring and visualizing the inside of the furnace and pipes as per example photograph below.
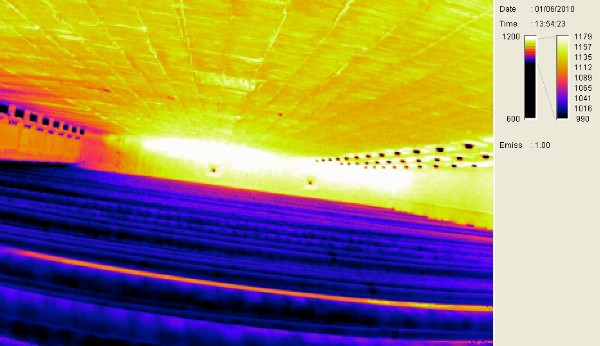
Today we can see what happens inside the furnace. We can watch continuously and during operation, running process condition the condition of all pipes inside the furnace. This is an incredible increase of possibilities to optimise the furnace process. Cost of operation, costs of material, costs of furnace exchange/switch can be saved now. One camera is easily compensated with optimised operation.
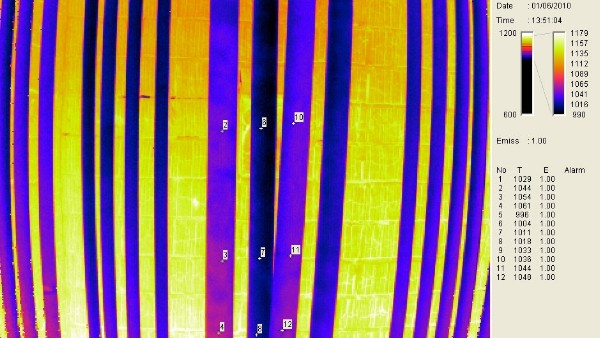
As per example pictures below we can see:
- exact temperatures on the pipe (remember: one image consist of 70 000 pixels and each pixel is one high and accurate temperature pint.) ,
means approx. 70 000 single measurements in one image. In case your pipes cover 50% of the image, then 35 000 single temperature points are recorded on these pipes. Smallest deviation in temperature, smallest deviation in colour (dark is lower temp.) is recorded. Increase of deposits and fouling is continuously monitored. All measurements and scans are recorded in archive database. Graphics and displays as per your configuration can be shown on your plant DCS and your log books. Developments in fouling can be checked at any time to any time backwards in the past. You can run a video of the last six month image and see the development of colour change, means development of fouling. Refer to the database or rum with your computer mouse over the image and see the actual temperatures. Many more features and analysing checks are possible. Please contact us for more information on this.
Origin: Land Instruments
Origin: Land Instruments
Origin: Rainer Sobottka/Shell
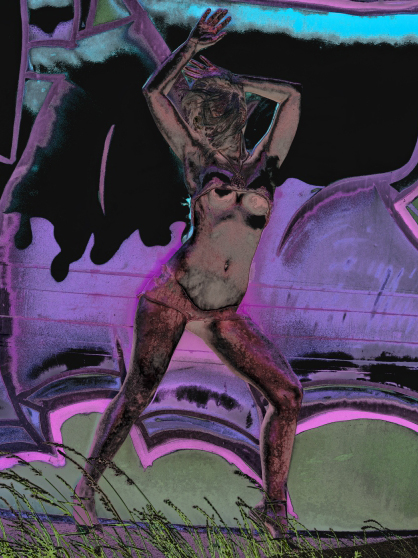
Infrared Imaging in private sectors


